Heron Link: A New Paradigm in Power Conversion for Utility-Scale Solar
Jump to Section:
Executive Summary
Figure 1 Heron Link Performance vs Conventional Inverter Skid
NPV Uplift, 100 MW-DC
Energy Yield
Availability
DC-to-MV Efficiency
The solar industry is at an inflection point. After sustained cost reductions over the last two decades, solar now accounts for more new generation capacity than any other source globally. But that cost curve is stalling in the face of new headwinds. Tighter financing conditions, supply chain volatility, and changing policies have pushed up solar’s levelized cost by 18% in the last year alone.1 With fewer opportunities for equipment cost reduction available, operational improvements matter more than ever for project viability.
At Heron, we see power conversion as a large, untapped lever to unlock higher project returns. For over a decade, the centralized inverter-plus-transformer skids that convert and regulate solar output have remained unchanged. Their inefficiencies and downtime are drags on project revenue, and their high servicing burden drives up operational costs.
Heron Link offers the industry a new path: an elegant, modular power conversion system that replaces the low-voltage inverter and medium-voltage step-up transformer. This architecture adds +6.0% of NPV uplift2 and over 50bps of incremental unlevered IRR for solar projects. The uplift comes from three sources: higher availability, improved energy yield, and lower O&M. Heron Link is manufactured in the U.S. and equipped with native grid-friendly inverter controls, retiring important risks that are impacting projects today.
1. Headwinds in the Solar Market
Utility-scale solar is being deployed on a global scale. In 2025, the world added nearly 650 GW-DC of new solar capacity, and active solar power plants generated roughly 2,778 TWh, serving 9% of the world’s electricity consumption.3 By 2030, the share of global electricity generation from solar is expected to grow to over 15%.4
Cost reductions from hardware innovation and scale have powered the emergence of solar as a significant source in the global energy mix. Solar module efficiency rose from 17% to nearly 25% in the last decade, driving down cost per watt at the system-level.5 At the same time, solar module costs have fallen by over 20% for every doubling in global capacity, driven by economies of scale.6 Those trends, alongside policy support in major markets and efficiency gains in plant design and construction, helped lower the levelized cost of energy (LCOE) for utility-scale solar by roughly 90% in just over a decade, from $323-394/MWh in 2009 to $30-41/MWh in 2021.7
Figure 2 Global Cumulative Solar Capacity (GW) vs Levelized Cost of Energy ($/MWh)
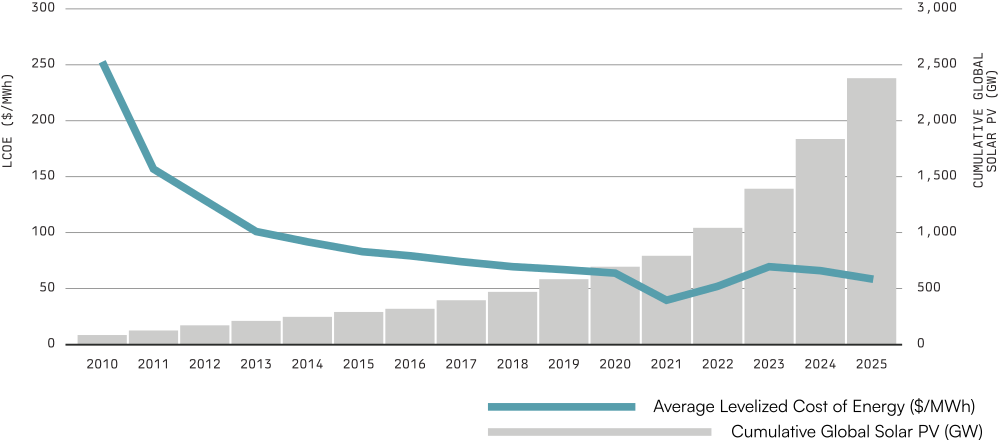
Recently, solar cost declines have started to reverse. In 2026, utility-scale solar LCOE rose to $40-98/MWh, driven by tighter financing conditions, supply chain uncertainty, and shifting incentive structures.8

Tighter financing conditions
Higher interest rates have raised the cost of project debt, which increases debt service requirements and compresses equity returns.9 In competitive offtake markets, developers cannot fully pass financing costs through to power purchase agreement (PPA) prices, impacting project margins.

Supply chain volatility
Tariffs, trade restrictions, and commodity price fluctuations are increasing the delivered cost of solar equipment. Silver prices alone have increased by 130% in the last year, pushing module prices up 7-15%.10 These pressures represent a structural shift in a project’s cost base, affecting equipment procurement, spares availability, and repair timelines.

Shifting incentive structures
Policy support for utility-scale solar is becoming conditional on supply chain origin. In the U.S., the One Big Beautiful Bill Act (OBBBA) phased out blanket federal tax credits while rewarding domestic content.11 In Europe, solar auctions are incorporating non-price criteria to limit reliance on Chinese components.12 Projects that cannot demonstrate compliant sourcing are increasingly exposed to cost and schedule risk.
These headwinds are forcing developers to find new solutions to protect project returns. Rethinking power conversion architecture is one option. Conventional solar inverters and MV transformers have not fundamentally changed in decades, even as other components of solar projects have improved. Next-generation power conversion equipment offers a direct path to higher energy yield, better reliability, and lower project risk.
2. A New Architecture for Power Conversion
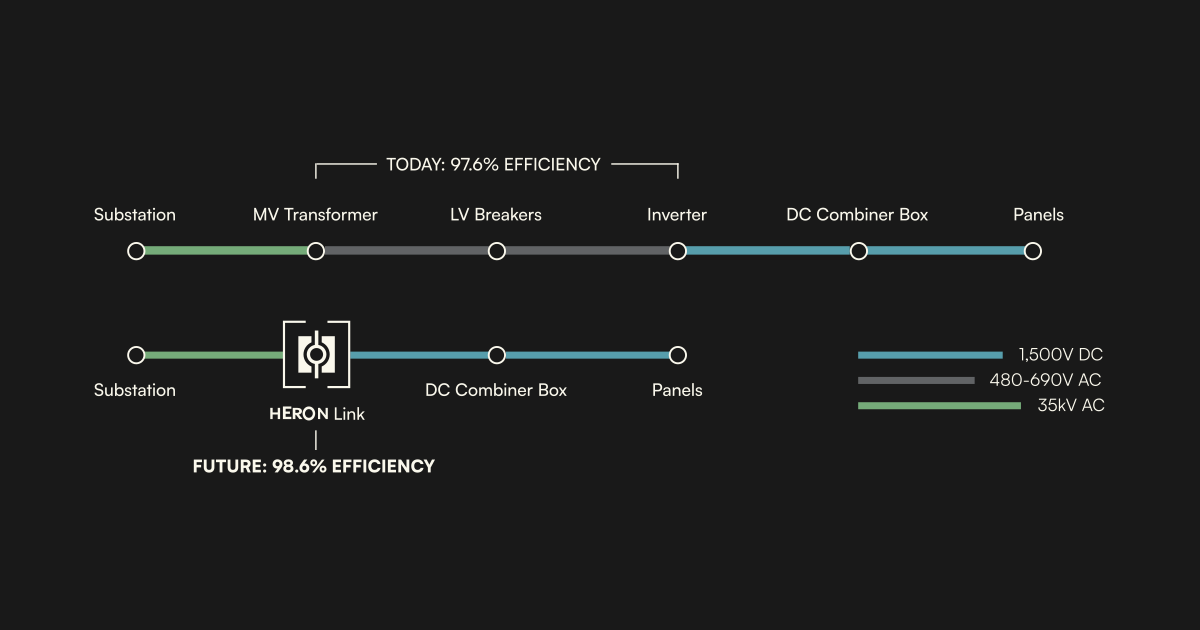
The Heron Link is a modular 5 MW medium voltage (MV) power conversion system purpose-built for utility-scale solar. It replaces conventional inverters and MV step-up transformers with an integrated power conversion architecture that enables higher project uptime, improved energy yield, and lower O&M costs. Beyond performance, Heron Link's U.S. manufacturing base and innovative grid controls reduce two of today’s prominent schedule risks: supply chain exposure and grid compliance.
Figure 3 Comparison of Conventional vs. Heron Link Architecture
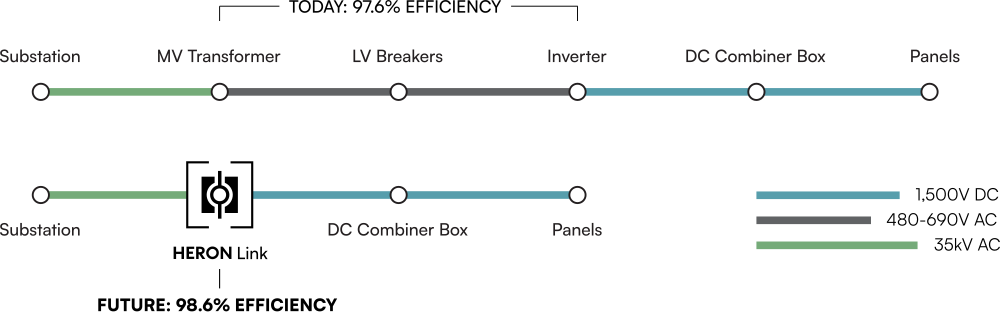
"Heron Link replaces conventional MV transformers and LV inverters with an integrated power conversion architecture."
Availability: more hours online
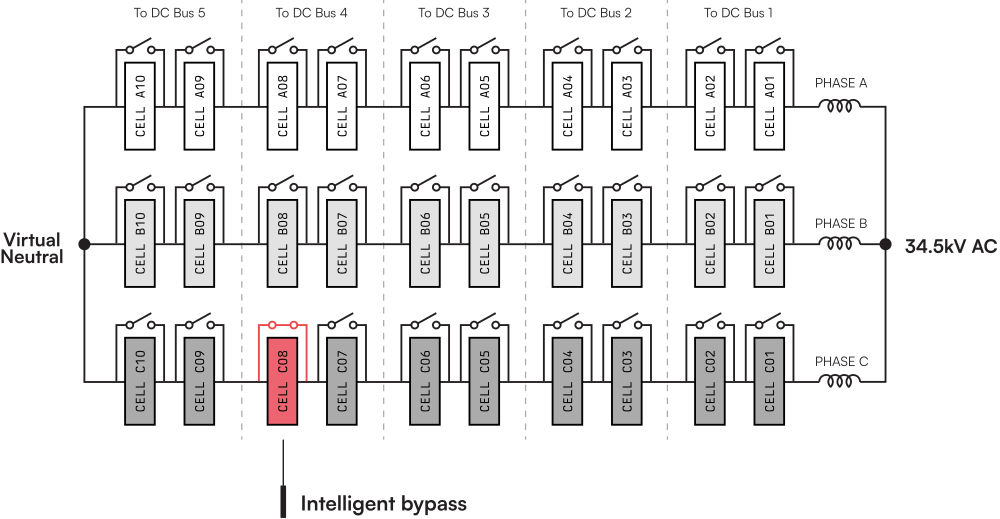
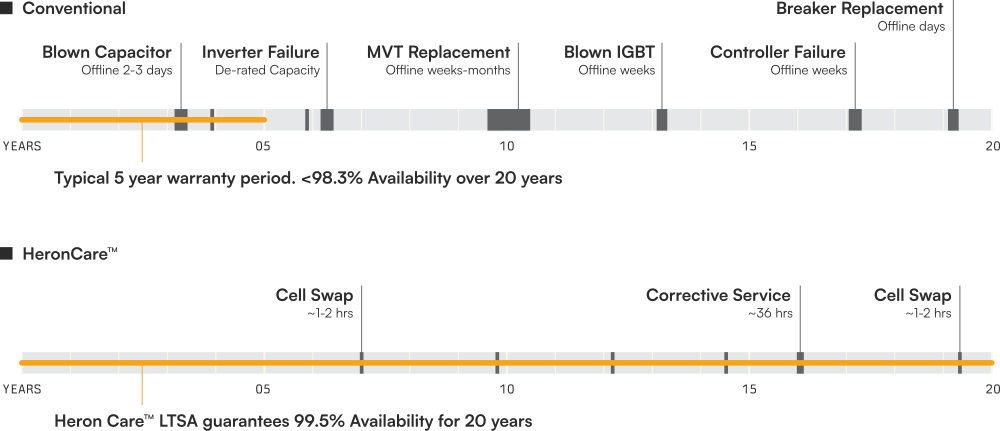
Conventional central solar inverters rarely achieve the availability that owners underwrite. Across a sample of over 1,000 operational plants, central inverters averaged just 98.3% availability, well short of the industry-expected 99% system availability.13 Heron Link clears this hurdle, delivering 99.5% lifetime availability through a modular, fault-tolerant design. The system houses thirty 167 kW power cells – ten per phase in series – and can tolerate up to two cell failures per phase while remaining operational. Fast-acting bypass devices automatically isolate faulted cells to preserve output voltage and grid compliance. Where a single fault can take a conventional inverter skid offline for weeks, Heron Link remains online until the next scheduled maintenance event, reducing downtime and protecting plant MWh output
Figure 4 Heron Link Fault-Tolerant Topology
Performance: more energy in every operational hour
Heron Link's power cells deliver 98.6% DC-to-MV conversion efficiency, or approximately half the losses of a conventional inverter-plus-transformer skid. The cabinet design also mitigates two operational drawbacks of today’s inverters. Where conventional inverters begin derating above 35-45 °C, Heron Link maintains full rated output up to 50 °C, keeping solar projects operational during the hot afternoons when demand is highest and improving the predictability of a project’s output. During non-generation hours, Heron Link draws just 0.2 kW of auxiliary load, reducing the idle tare losses of MV transformers that erode solar plant economics overnight. These three gains alone – conversion efficiency, de-rate threshold, and auxiliary loads – pay back Heron Link’s incremental CAPEX in less than three years.
"Heron Link remains online until the next scheduled maintenance event, protecting plant output and project revenue."
O&M: lower and more predictable lifetime costs
Inverters-plus-transformer skids are the largest source of unplanned energy losses at solar projects and a recurring strain on asset operations teams.14 In a study that tracked more than 80,000 solar project maintenance events, inverters accounted for nearly 60% of all service tickets.15 The entire system has a significant preventative maintenance burden: for example, transformer oil sampling is scheduled annually, and air filter cleaning can occur as frequently as twice a year in dusty extreme climates. Conventional skids typically carry a 5-year manufacturer warranty and a 10-year service life, short of a 20-to-25-year PPA term.16 Once a skid’s warranty ends, owners carry the full cost of any replacements. When equipment fails outside the warranty period, OEMs have limited commercial incentives to stock compatible spare parts or help diagnose faults, and outages can last from days to weeks.
Heron Link takes a first-principles approach to reliability, reducing maintenance costs and improving predictability. At the architectural level, the cabinet design eliminates transformer oil and LV switchgear entirely. At the component level, Heron Link uses remote-resettable contactors that clear overcurrent faults without a truck roll and modular power cells that are field-replaceable in 30 minutes. Every Heron Link is backed by HeronCare, a long-term service agreement (LTSA) that contractually guarantees 99.5% availability for 20 years at a fixed fee schedule, including backwards compatible spare parts. That commitment is supported by three capabilities: models that predict failure risk, AI agents that triage faults, and scheduling algorithms that maximize service tasks per truck roll. With HeronCare, Heron takes on the long-term corrective maintenance risk, aligning incentives with the asset owner to maximize availability and real-world resilience.
Figure 5 Conventional Corrective Maintenance vs. HeronCare LTSA
Supply chain: certainty in a market short of supply
Shifting trade policy and supply chain bottlenecks have made equipment procurement a major source of schedule and delivery risk. Last year, Chinese vendors comprised nearly 50% of the U.S. utility-scale inverter market, led by Sungrow.17 Regulators globally are acting to limit this kind of concentration. In July 2026, the U.S. FCC added foreign-produced inverters to its Covered List, blocking new equipment authorizations.18 In spring 2026, the European Commission restricted access to EU funds for projects procuring inverters from high-risk suppliers.19 Compounding this risk, global shortages of MV pad-mount transformers have driven U.S. unit costs up 78-95%, increasing import dependence.20
Heron Link insulates projects from both risks. It will be manufactured at Heron’s Morgan Hill, CA facility with 40 GW of annual capacity, and its direct DC-to-MV power electronics architecture eliminates MV transformers from the bill of materials entirely. Developers get a domestic supply source that helps them sidestep ongoing supply chain volatility.
“Equipment procurement is now a leading source of schedule and delivery risk."
Grid controls: improved interconnection position
Conventional solar inverters rely on an external voltage reference, leaving them prone to tripping whenever grid conditions fluctuate beyond a narrow range.21 This grid-following behavior creates challenges for grid operators, who have historically managed the stability of large power systems with synchronous, turbine-based generators that stabilize grid frequency and voltage with their rotational inertia. Regulators globally are scrutinizing new solar projects for their impacts on power grids, a push accelerated by major grid events such as the April 2025 Iberian Peninsula blackout.22 In the U.S., where interconnection timelines already stretch beyond five years, verifying inverter behavior represents one more source of potential schedule risk.23
Heron Link’s controls replicate the behavioral dynamics of a current-limited synchronous generator, giving grid operators familiar tuning parameters and predictable modeled behavior. With its grid-forming capable controls, Heron Link operates stably even in weak-grid regions where installation of solar generation with grid-following inverters would otherwise be challenging. To support the verifiability and extensibility of our controls, Heron also developed OpenIBR, an open-source control library for IBRs that acts as the Heron Link’s grid-interactive control layer. For developers, Heron’s controls approach unlocks two outcomes: improved model fidelity for interconnection studies, and the ability to site projects at weak-grid points of interconnection.
Table 1 Summary of Heron Link vs Conventional
3. Impact on Project Returns
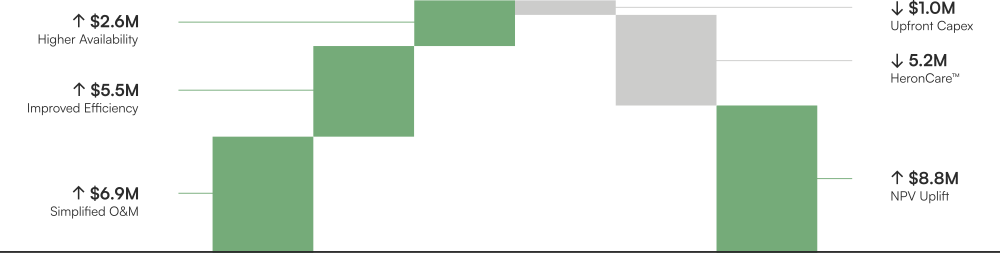
Together, the uptime, performance, and O&M gains with Heron Link improve project NPV by 6.0% (50+ bps unlevered IRR uplift), even after the slightly higher upfront capital cost and HeronCare.24
Figure 6 35 Year Net Present Value with Heron Link
Try it yourself. Start from Heron's base case, then pressure-test the economics under your own commercial and operating assumptions.
Figure 7 Simplified NPV and unlevered IRR calculator
The NPV figures are only part of the picture. Heron Link strengthens a project’s financing case in two ways: higher yield and reliable sourcing.
Higher yield
An archetypal 100 MW-AC project with Heron Link generates an additional 170 GWh over 35 years, a 2.2% uplift in energy yield. That higher, more consistent output narrows the gap between an asset’s P50 and P90 estimates, supporting firmer PPA delivery commitments and larger debt capacity on the same project.
Reliable sourcing
Heron’s U.S. manufacturing base gives Independent Engineers clear answers on equipment origin and delivery during diligence. It also reduces the impact of import tariffs, eliminates exposure to the FCC Covered List, and qualifies projects for incentives in the U.S. and Europe. Each risk retired means projects perform closer to their modeled return.
4. The Case for Heron Link
Power conversion is a significant, untapped opportunity to improve the return of solar projects in an otherwise difficult market. With Heron Link, projects benefit across the development lifecycle:
- 99.5% availability over 20 years with a resilient, fail-operational design that eliminates unexpected mid-life replacements
- 2.2% higher lifetime energy yield, enabling firmer delivery commitments in PPAs and larger debt capacity
- Reduced maintenance burden protecting project margins across the financed life
- 40 GW per year of U.S.-based manufacturing, hedging against policy changes and tariffs
- Predictable, open inverter controls that improve model fidelity and open up new potential project sites
The winners of solar’s next decade will be the developers, IPPs, and asset owners who move first. We are working with partners today to model Heron Link in their pipelines. Reach out with your project specifications and let’s get into the details.
For detailed assumptions, a model walkthrough, or a project-level evaluation, contact Heron: product@heronpower.com.
Footnotes
Download White Paper